
COVID cases by Vaccine rate; this chart across US tells the story as clearly as possible; simple, elegant, this being we are screwed with the COVID vaccine & it MUST be STOPPED! it drives infection
by Paul Alexander
I, Geert, Malone, McCullough etc. have been saying, this is a non-sterilizing vaccine, non-neutralizing Abs, binds but can't stop infection or transmission; drives variants & immune escape & infection
Bottom line: using a non-sterilizing vaccine that does not cut the chain of transmission, we will never ever tamp down and calm this pandemic, and the more we vaccinate, the more the infection in the vaccinated goes up; but this is not a function of some intrinsic property of the virus; no, it is due to the sub-optimal ‘immature’ and mismatched (based on the legacy Wuhan strain/original antigenic sin/OAS at play) non-neutralizing Abs binding to the virus but not eliminating it and as such, placing the virus’s infectiousness (spike) under massive immune pressure; evidence has emerged to show that the vaccinal Abs are actually facilitating and enhancing infection in the vaccinated in the URT; it enhances infection in the URT and prevents severe disease in the LRT (prevents transfection from infected cell to non-infected cell in the LRT).
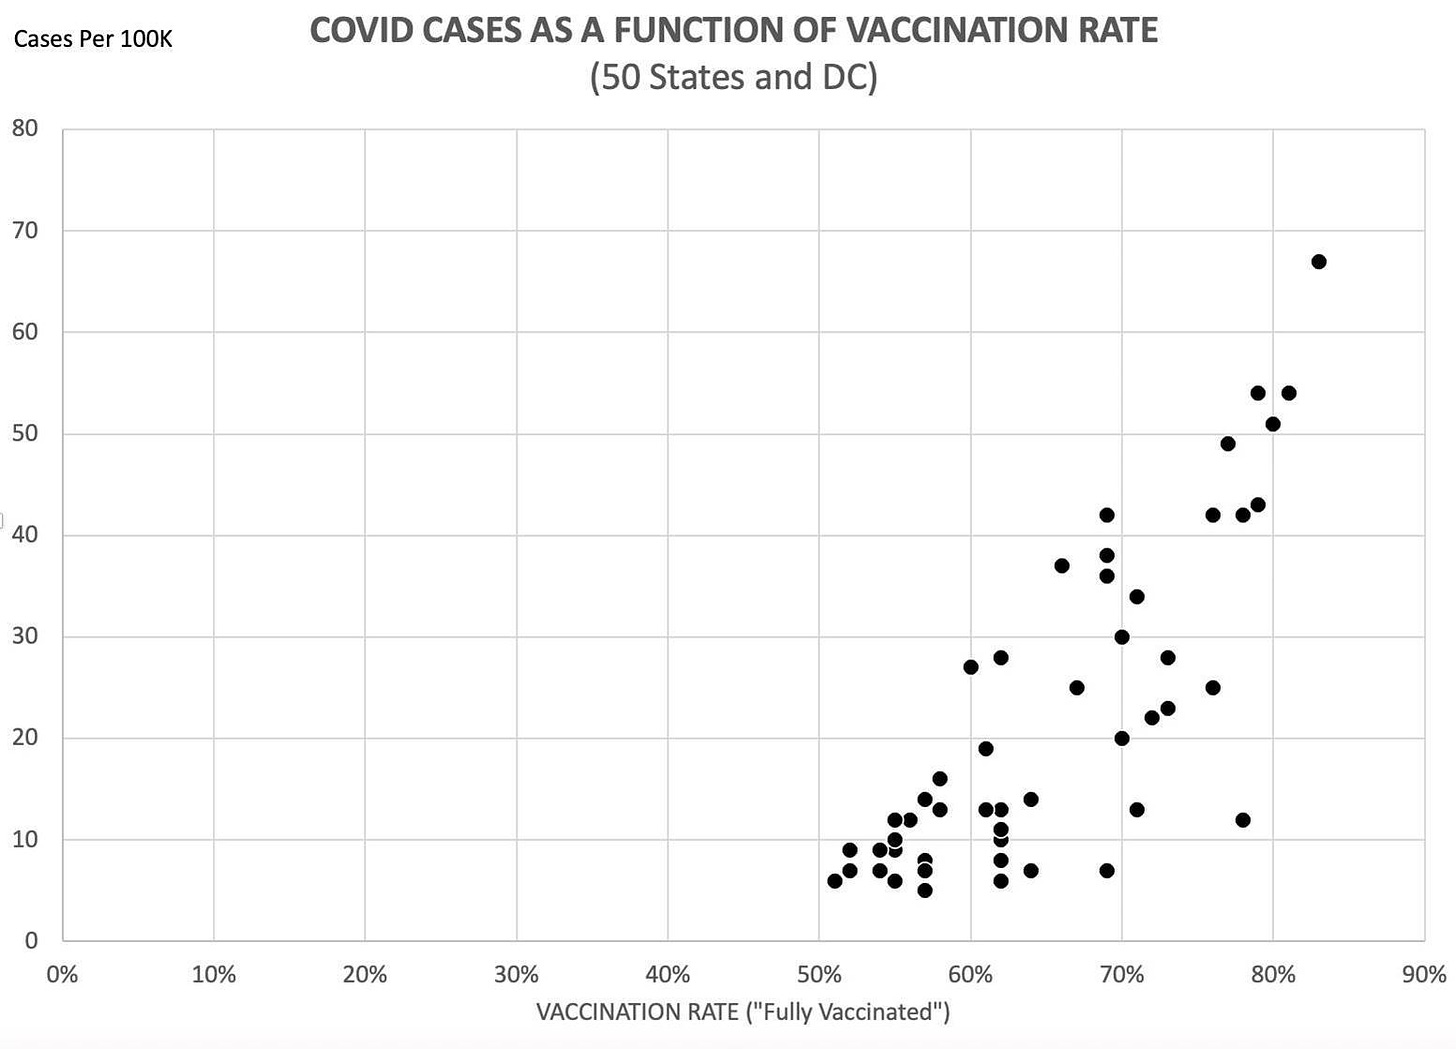
This chart was built by a friend of a friend of mine by hand using the publicly available data from the NYT. https://www.nytimes.com/interactive/2021/us/covid-cases.html?pageType=LegacyCollection&collectionName=Maps+and+Trackers&label=Maps+and+Trackers&module=hub_Band®ion=inline&template=storyline_band_recirc